
Which States Are the Most Financially Literate?
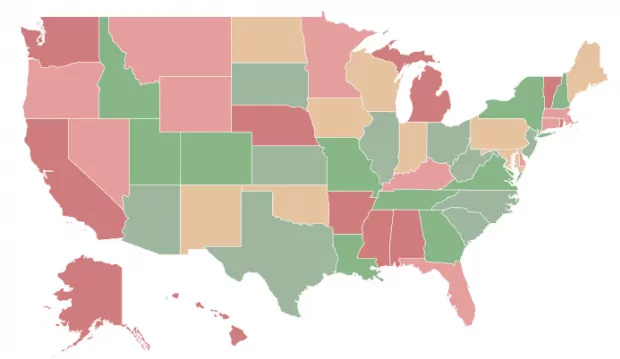
There’s not much data on financial literacy, because not enough people take it seriously. That may be why American 15-year-olds have lower financial literacy levels than their counterparts in China, Estonia, and the Czech Republic. But this map shows everything we could find — from state laws on teaching the subject to financial habits and how well people perform on financial literacy quizzes. Hover your cursor over a state to see how it ranks overall, and click it for more details. Check it out, then see our methodology below.
See if you know the answers to some of the most asked questions about Financial Literacy and credit.
| State | Rank | State | Rank | State | Rank | State | State | Rank | |
|---|---|---|---|---|---|---|---|---|---|
| Utah | 1 | Texas | 11 | Iowa | 21 | Wyoming | 31 | Vermont | 41 |
| Virginia | 2 | South Dakota | 12 | North Dakota | 22 | Oregon | 32 | California | 42 |
| Idaho | 3 | Illinois | 13 | Wisconsin | 23 | Florida | 33 | Mississippi | 43 |
| New Hampshire | 4 | West Virginia | 14 | New Mexico | 24 | Montana | 34 | Nebraska | 44 |
| Missouri | 5 | New Jersey | 15 | Maryland | 25 | Minnesota | 35 | Washington | 45 |
| Colorado | 6 | South Carolina | 16 | Oklahoma | 26 | Nevada | 36 | Hawaii | 46 |
| Tennessee | 7 | North Carolina | 17 | Indiana | 27 | Connecticut | 37 | Rhode Island | 47 |
| New York | 8 | Kansas | 18 | Maine | 28 | Delaware | 38 | Alaska | 48 |
| Louisiana | 9 | Ohio | 19 | Pennsylvania | 29 | Massachusetts | 39 | Alabama | 49 |
| Georgia | 10 | Arizona | 20 | Kentucky | 30 | Michigan | 40 | Arkansas | 50 |
Sources and methodology
For Financial Literacy Month, we wanted to pull together every state-level assessment we could find to get a picture of how well we understand finances in the U.S. Unfortunately, it’s not a popular topic outside of personal finance blogs — we only found a few useful sources of information.
First, there’s the Champlain College Center for Financial Literacy, which in 2013 issued a national report card on state efforts to improve financial literacy in high schools. States were given grades ranging from A to F depending on what their laws required, from a standalone personal finance class, to a few lessons tucked into another subject, to nothing at all. The center hasn’t followed up on this report, so some states may have updated their laws since then.
There’s also something called the National Financial Capability Study, conducted every three years by the nonprofit Financial Industry Regulatory Authority. Last released in 2013, this is the most comprehensive data we have about financial literacy since FINRA surveyed more than 25,000 Americans about their financial habits and knowledge. You can take FINRA’s five-question financial literacy quiz online. Aside from the quiz results, we factored in several of their metrics for our overall ranking — stuff like how many people have bank accounts, save for retirement, and check their credit. You can see all the factors we used when you click on a state.
Lastly, there’s The National Financial Educators Council, a company dedicated to teaching personal finance, which has an ongoing 30-question National Financial Literacy Test that more than 70,000 participants to date have taken. It’s designed for high school students — and that’s the data we used — but they share the results of all age groups. The national average performance in 2021 was 64%, which was a 2% drop from 2020.
Just for comparison purposes — we didn’t use it in the financial literacy ranking — the map also includes the average debt as a percentage of the average income. This data comes from an Urban Institute report we used in a previous map.