
The Link Between Debt and Death
People die more often in states with low average incomes and where more people have debt in collection
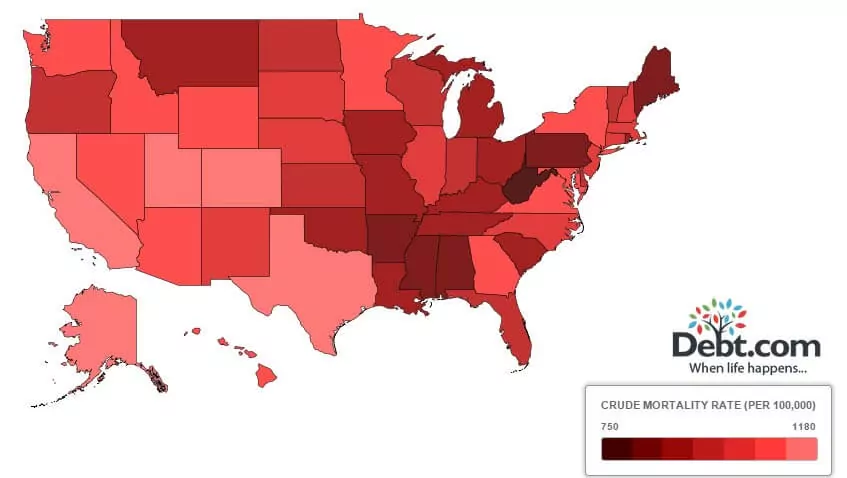
This map shows U.S. crude mortality rates — how many people per 100,000 died in a year — and median incomes from 2013. Hover your cursor over a state to see how it ranks for both, and click a state for details. Check it out, then see our analysis below.
We got mortality data from the Centers for Disease Control and Prevention, median income from the Census Bureau, and debt collection data from the Urban Institute (which got it from TransUnion).
| State | Mortality rank | Income rank | State | Mortality rank | Income rank | State | Mortality rank | Income rank | |
|---|---|---|---|---|---|---|---|---|---|
| West Virginia | 1 | 48 | Florida | 18 | 39 | Wyoming | 35 | 13 | |
| Alabama | 2 | 47 | Indiana | 19 | 34 | Idaho | 36 | 38 | |
| Arkansas | 3 | 49 | Vermont | 20 | 20 | Maryland | 37 | 1 | |
| Mississippi | 4 | 50 | Kansas | 21 | 27 | Nevada | 38 | 26 | |
| Maine | 5 | 35 | Wisconsin | 22 | 24 | New York | 39 | 16 | |
| Pennsylvania | 6 | 22 | Oregon | 23 | 28 | Arizona | 40 | 30 | |
| Oklahoma | 7 | 41 | North Dakota | 24 | 19 | Virginia | 41 | 8 | |
| Kentucky | 8 | 46 | Delaware | 25 | 15 | Minnesota | 42 | 9 | |
| Ohio | 9 | 32 | North Carolina | 26 | 40 | Georgia | 43 | 33 | |
| Tennessee | 10 | 42 | Nebraska | 27 | 25 | Hawaii | 44 | 4 | |
| Missouri | 11 | 37 | South Dakota | 28 | 29 | Washington | 45 | 14 | |
| Montana | 12 | 36 | Connecticut | 29 | 5 | Texas | 46 | 23 | |
| Iowa | 13 | 21 | New Hampshire | 30 | 7 | California | 47 | 10 | |
| Louisiana | 14 | 43 | Massachusetts | 31 | 6 | Colorado | 48 | 12 | |
| Michigan | 15 | 31 | New Mexico | 32 | 45 | Utah | 49 | 11 | |
| South Carolina | 16 | 44 | Illinois | 33 | 17 | Alaska | 50 | 2 | |
| Rhode Island | 17 | 18 | New Jersey | 34 | 3 | Data correlation | r = -0.6717 | ||
Analysis
A new Pew Charitable Trusts report highlights the financial fragility of Americans — less than half of households have enough money saved to replace one month of income in case of job loss. A similar number are spending everything they make or more, and 8 percent are “debt-challenged,” meaning their payments are more than 41 percent of their income.
“Despite the national recovery, most families feel vulnerable and stressed, and could not withstand a serious financial emergency,” the report says.
We were interested in the correlation between the stress of debt and well-being, since previous academic research has shown debt has a negative impact on mental health and is associated with several health risk.
Using data correlation functions in Microsoft Excel, we saw a weak positive relationship (r=0.2587) between state mortality rates and the population with debt in collections. But we found a much stronger negative relationship (r=-0.6717) between mortality and median (typical) income.
What does that mean? We don’t have to get technical. Even without looking at graphs or knowing how those numbers work, you can look at the table above and see what’s going on. A state like West Virginia has the highest mortality rate and nearly the lowest median income, while Alaska has the lowest mortality rate and the second-highest income. South Dakota is middle-of-the-road for both. Meanwhile the weaker relationship, which was positive, suggests mortality goes up as default on debt does.
It’s worth noting the adage “correlation does not imply causation” — we’re not saying debt kills you or that being poor means you die sooner, because we don’t know that. (There’s a whole website dedicated to bizarre correlations.) But we’re pretty sure that debt isn’t good for your health.


